Understand the business — without opening a spreadsheet.
The reports module shows the metrics you actually act on: revenue per crew, quote-to-order conversion, gross margin per job type. Everything updates in real time.
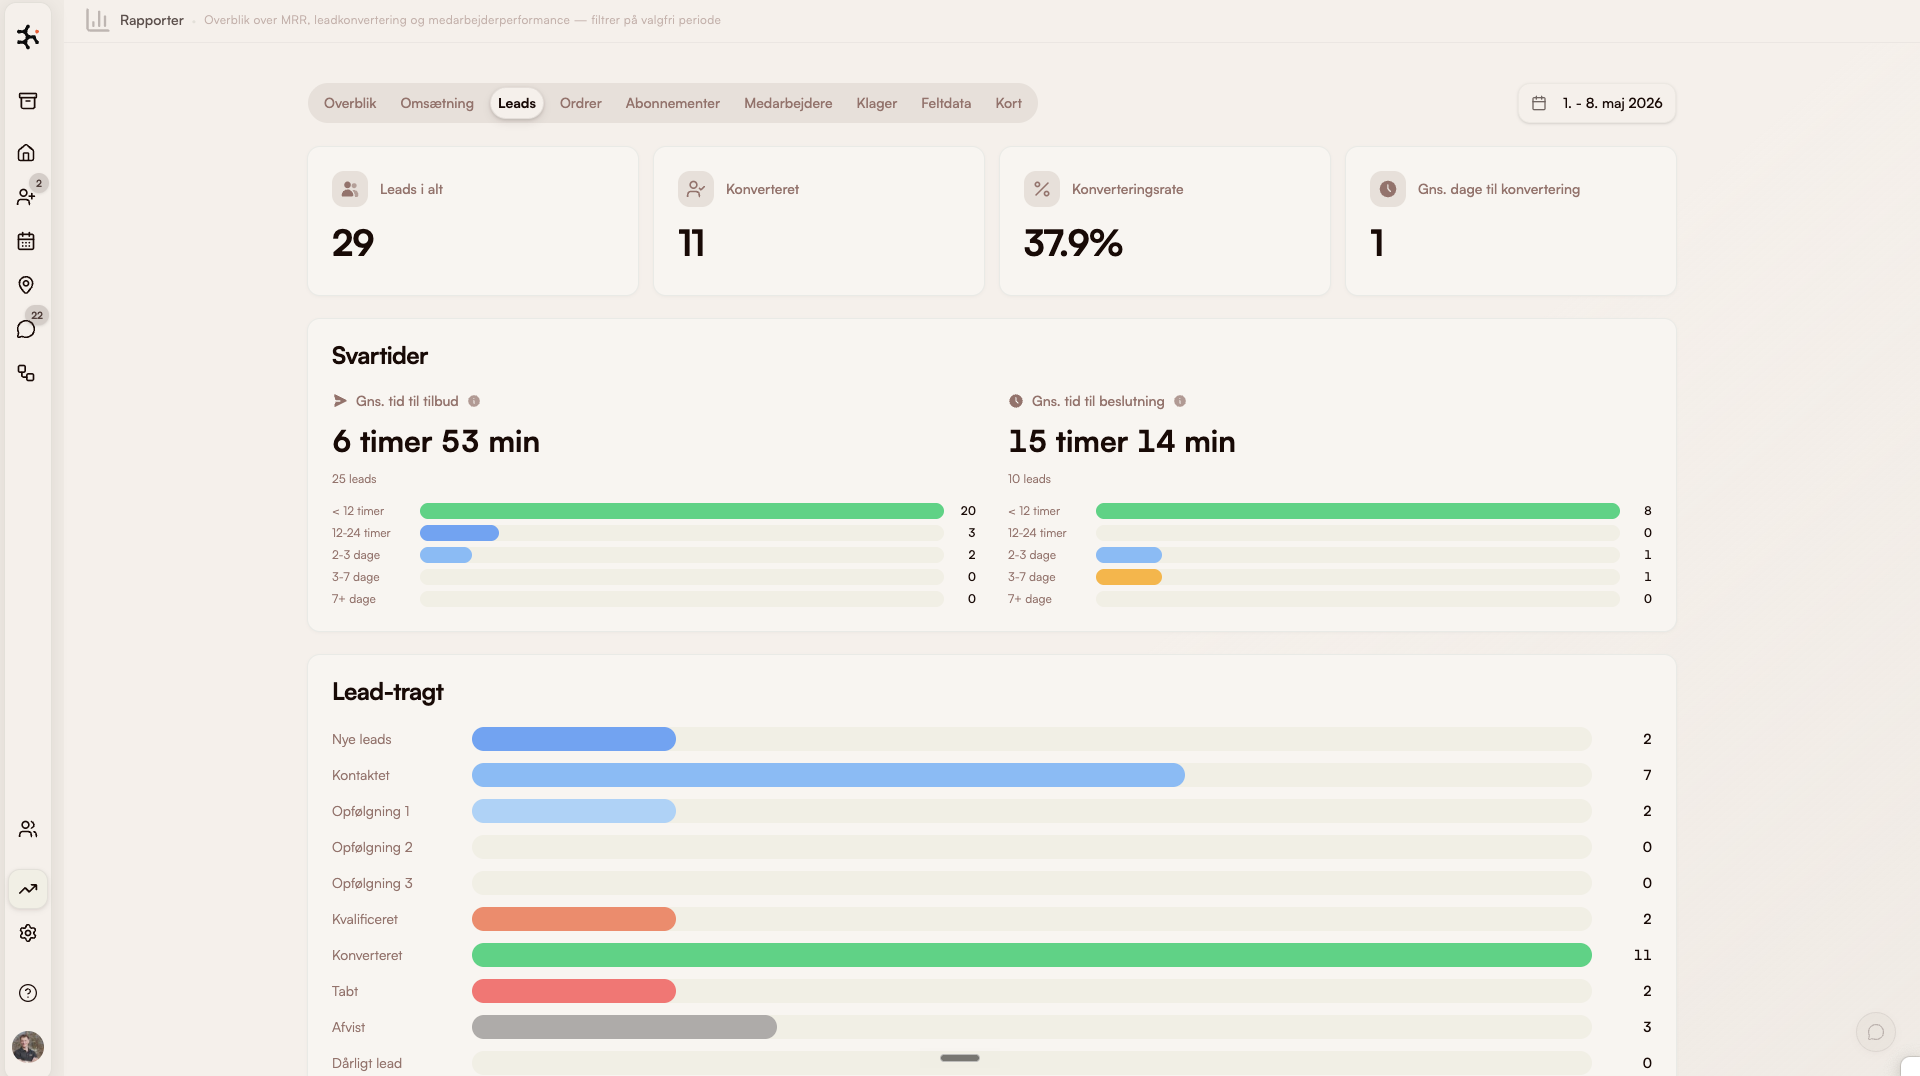
What's inside Reports
KPI dashboard
Revenue, jobs, conversion rates, and trends over time — front and center.
Crew KPIs
Jobs, revenue, and efficiency per crew member. A fair basis for bonuses or coaching.
Quote conversion
How many quotes become orders? Where do people drop off? Find the bottlenecks.
Audit log
Who changed what, and when? Complete history for every change in the system.
How owners use the reports module
Window cleaners
Owner sees conversion on new leads has dropped from 35% to 22% in the last month → identifies that Facebook leads are dropping off → adjusts the quote template.
Read more about this industryCleaning companies
Manager uses crew KPIs as the basis for half-year reviews — fair numbers instead of gut feeling.
Read more about this industryPlumbers & electricians
Owner sees that gross margin per job type is higher on service visits than new installs → refocuses the sales effort.
Read more about this industryModules that pair with Reports
Customer registry
Every customer, in one place
Searchable registry with history, documents, communication, and address validation via DAWA.
Learn moreInvoicing
Invoice from the job
One-click invoicing. Syncs to e-conomic, Dinero, or Billy. MobilePay supported.
Learn moreWorkflow
Automate the repetitive
Pick the data, the schedule, and the recipient. The workflow sends the message — or files the summary in your inbox.
Learn moreFrequently asked questions about KPI reporting
Which metrics are in the dashboard?
Can I export reports to Excel or PDF?
How fresh is the data?
Can I compare time periods?
What is logged in the audit log?
Go deeper on reports
Trades using this module, problems it solves, integrations it fits with, and articles where we go into detail.
Trades where this module makes a difference
How reports is used in the trades we work most closely with.
Window cleaners
Classic case: fixed routes, subscriptions and fast morning dispatch.
Read moreCleaning
Contracts, key tracking and hour-based invoicing — built for cleaning companies.
Read moreHVAC
Equipment register, urgent dispatch and mandatory inspections.
Read morePlumbing
Urgent dispatch, project jobs and time/materials tracking.
Read moreLandscaping
Seasonal planning and weather-aware route optimization.
Read moreProblems this module solves
Deep dives into the operational challenges this module addresses — from route optimization to customer portal.
Integrations that fit
Tools Clientflow connects directly with — so data never has to be entered twice.
Read more
Our own articles on the topic — from concrete numbers to strategic choices.
5 signs you're ready for one system
When Excel and SMS no longer cut it — what the threshold looks like.
Read moreFrom 10 programs to one
What actually happens when a service business consolidates operations.
Read moreAutomatic invoicing for service businesses
How much the invoice tail costs you — and how auto-invoicing eliminates it.
Read moreWhy we built Clientflow
Daniel tells the story behind the platform — and why the trade needed something new.
Read moreHow to use it in practice
Help center articles — for when you want to look under the hood.
Compare with alternatives
How Clientflow stacks up against other tools in the market.
Ready to run your entire
business in one system?
Try the demo for 7 days — real data. We help you get started.